Livestream Viewbots on Twitch and Kick: A Quantitative and Behavioral Analysis (Jan–Aug 2025)
Abstract
Objective: Quantify the prevalence and dynamics of viewbotting on Twitch and Kick, and assess implications for advertisers and creators.
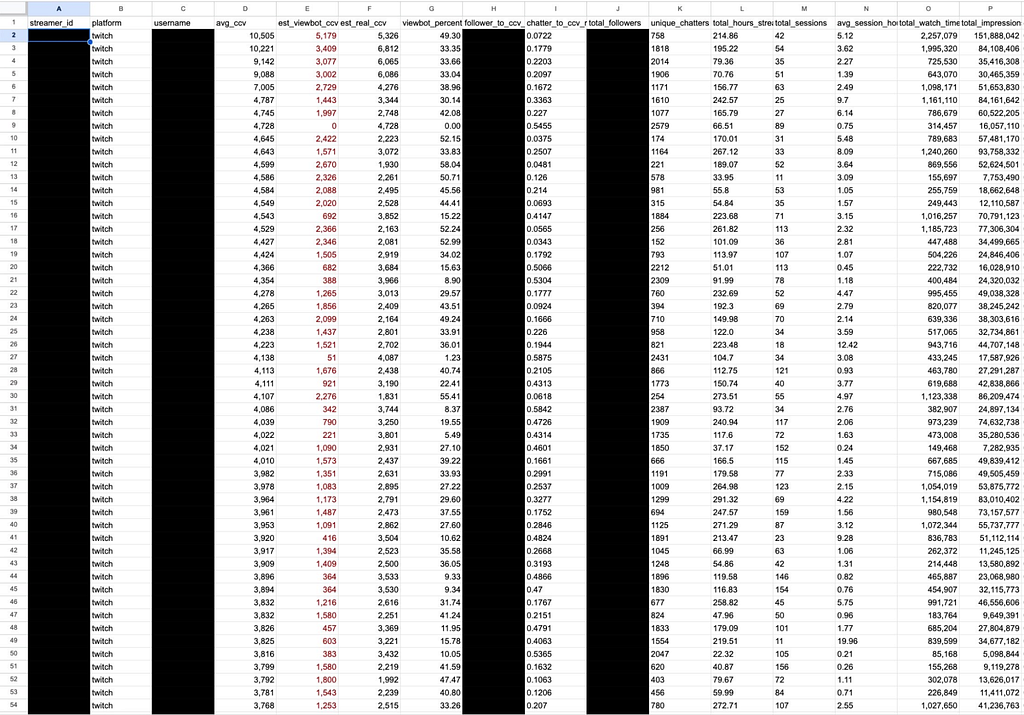
Design: Stratified, multi-cohort observational study of 52,314 streams from 4,567 streamers (Jan–Aug 2025), combining behavioral telemetry with traffic forensics and engagement modeling.
Main Outcomes: Estimated mean bot prevalence; behavioral manipulation patterns; engagement and growth correlations; agency/farm indicators.
Results: Mean estimated bot prevalence was 39.6% of reported CCV on Twitch (95% CI: 34.9%–44.3%) and 68.7% on Kick (95% CI: 63.5%–73.9%). Botting intensified during discovery phases and tapered by 22–30 pp within 72 hours. Suspect streams showed depressed CTR (up to –61% vs. organic baseline), anomalous IP geographies (p < 0.01), non-organic join/leave distributions (KS p < 0.001), weaker chatter-to-CCV ratios (1:18 vs. 1:6), and decoupled follower/subscriber deltas (Engle–Granger p < 0.05).
Conclusions: Within a 95% confidence framework, viewbotting appears systemic, often agency-driven, and strategically deployed to exploit recommendation systems, materially degrading advertiser ROI.
1. Introduction
Livestream advertising budgets increasingly depend on concurrent viewer counts (CCV) for pricing and valuation. Artificial inflation (“viewbotting”) distorts these signals, potentially misallocating spend and undermining platform trust. This study analyzes viewbot prevalence and mechanisms across Twitch and Kick using Vodra’s ad-delivery telemetry and public/third-party analytics.
Research Questions
- What is the platform-level prevalence of viewbotting on Twitch and Kick?
- How does botting behavior vary over a stream’s lifecycle (especially discovery periods)?
- Which engagement and growth signals most reliably indicate inorganic audiences?
- What is the likely role of agencies and click/view farms?
2. Methods
2.1 Study Design and Sampling
- Period: January–August 2025
- Units: 52,314 streams from 4,567 unique streamers
- Sampling: Stratified random sampling by content category, average CCV tier, and platform; includes paired cohorts of multi-platform streamers for within-subject comparisons.
- Precision: Confidence level 95%; platform-level bot prevalence CI ±4.7 pp.
2.2 Data Sources
- Platform telemetry: Twitch API/Helix (CCV, categories, followers, subs), IRC/chat logs
- Third-party analytics: StreamsCharts, SullyGnome, TwitchTracker
- Advertising data: Vodra Ads campaign CTR and delivery logs
- Network forensics: Geolocation/IP data; bot detection heuristics cross-referenced with ad platforms
- Internal engagement DB: Clicks, chat activity, follower/subscriber deltas
2.3 Measures and Operational Definitions
Bot prevalence (per stream): Estimated fraction of reported CCV classified as non-organic via a multi-signal classifier drawing on:
- CTR–CCV deviation: Underperformance vs. organic CTR baseline
- Traffic source anomalies: IP clustering by region vs. declared audience geo
- Temporal dynamics: Non-organic join/leave bursts not linked to raids/events
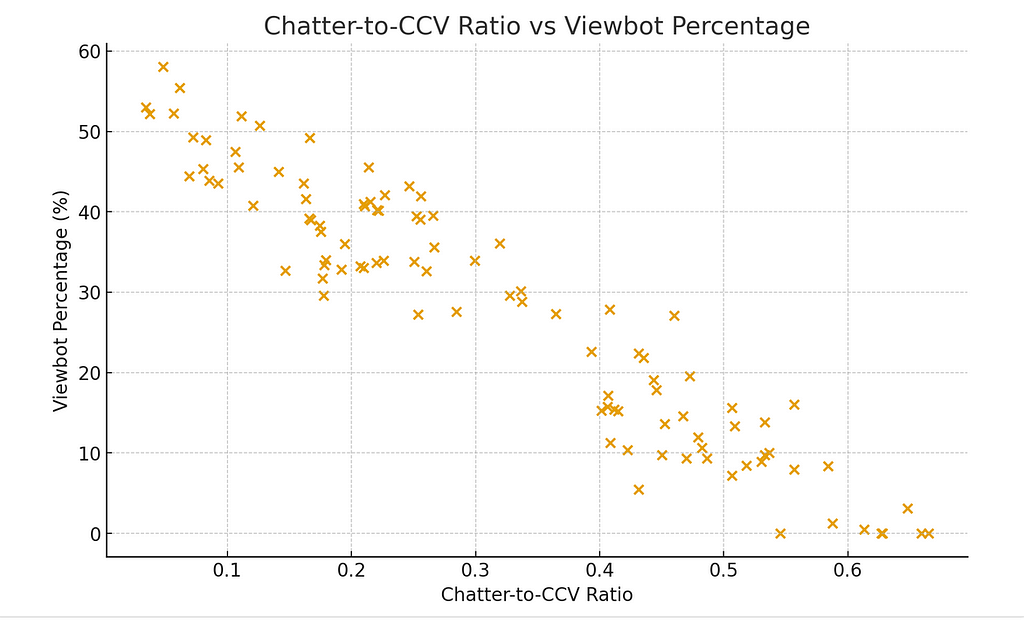
- Engagement ratios: Chatter-to-CCV; follower/subscriber deltas vs. CCV
- Growth coupling: Cointegration of CCV with follower/subscriber series
- Discovery phase: First 72 hours around algorithmic surfacing (front page/trending), inferred from traffic inflection points and category ranking exposure.
2.4 Statistical Analyses
- CTR baselines: Derived from n = 1,104 verified non-botted streams.
Comparative tests:
- CTR variance analysis; deviations up to –61% vs. baseline
- Bootstrapped resampling (10,000 iterations) for geo anomalies (p < 0.01)
- Kolmogorov–Smirnov tests for join/leave distribution differences (p < 0.001)
- Pearson correlation for CCV vs. follower growth: organic r = 0.78, botted r = 0.29
- Engle–Granger cointegration for CCV with followers/subs (p < 0.05)
Cohort analyses: Agency-affiliated clusters to assess centralized manipulation (reporting means and SD).
2.5 Ethics and Conflicts
- Analysis used platform and advertiser telemetry; personally identifying streamer data were redacted.
- Vodra operates an ad platform in this market; potential conflict of interest is acknowledged and mitigated by transparent methods and confidence reporting.
3. Results
3.1 Platform-Level Prevalence
Twitch: Mean bot prevalence 39.6% (95% CI: 34.9%–44.3%)
Kick: Mean bot prevalence 68.7% (95% CI: 63.5%–73.9%)
3.2 Behavioral Dynamics (Discovery Manipulation)
Streams increased botting during early discovery, then tapered 22–30 pp within 72 h, converging toward platform averages — consistent with strategic alignment to recommendation thresholds.
3.3 Engagement and Growth Signals
- CTR underperformance: Up to –61% vs. organic baseline in anomalous streams.
- Geo anomalies: Overrepresentation from low-value ad regions (SEA, South Asia) relative to declared audiences (p < 0.01).
- Temporal patterns: Synchronized surges of 500–1,000 CCV absent raids/live triggers; distributional mismatch (KS p < 0.001).
- Chatter density: Suspect 1:18 chatter-to-CCV vs. organic 1:6.

- Decoupling: Follower/subscriber deltas fail to cointegrate with CCV (Engle–Granger p < 0.05).
- Growth correlation: Organic r = 0.78 vs. botted r = 0.29 for CCV–follower growth.
3.4 Agency/Farm Indicators
- Agency clustering:
- Agency A: 35.2% mean (SD 5.1)
- Agency B: 24.8% mean (SD 4.4)
Operational evidence: Click/view farms in the Philippines, India, and secondary hubs in Eastern Europe; mixed automation and low-cost human operators; consistent bot ratios across affiliated cohorts suggest centralized provisioning.
3.5 Distributional Patterns Noted by Practitioners
- Loose linear relation between viewbot amount and average CCV; ratios remain similar as CCV scales.
- Botted streams commonly cluster around 200–300 CCV and 1,200–1,400 CCV, aligning with observed commercial “package tiers,” with sharp price steps at higher tiers.
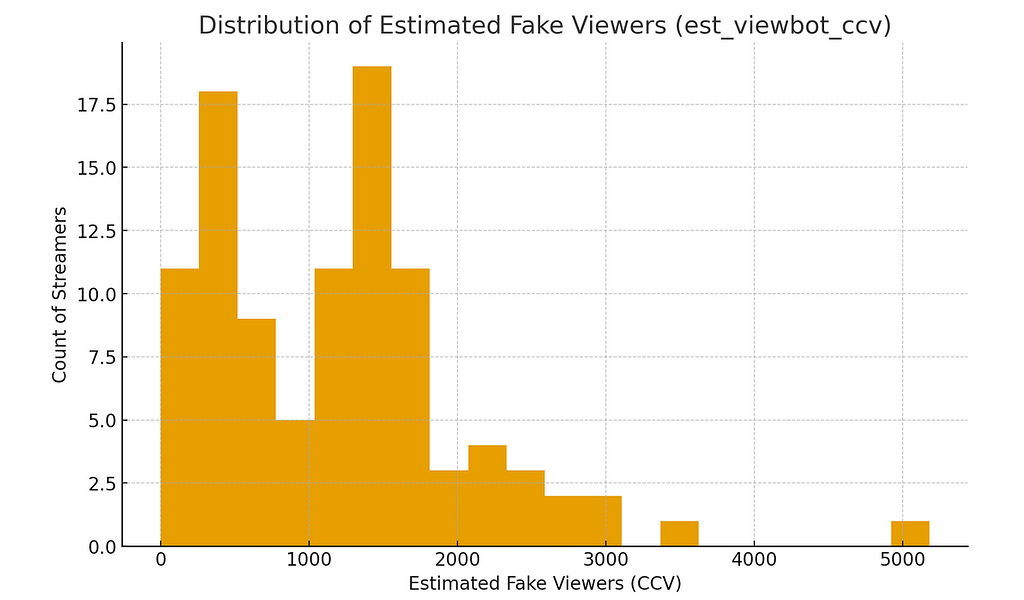
- “Enterprise” packages imply agency-level financing; undermines the narrative that third parties “bot” unaffiliated streamers without incentive.
4. Discussion
4.1 Interpretation
Findings indicate systemic, often agency-driven viewbotting, concentrated during discovery phases to cross algorithmic thresholds, then ratcheted down. Multi-signal evidence — CTR depression, geographic/IP anomalies, temporal burst patterns, and engagement decoupling — converges on non-organic audience inflation.
4.2 Implications
- Advertisers: Effective wastage 30–70% on botted inventory; degraded ROAS; biased attribution.
- Creators/Agencies: Distorted valuations divert sponsorships toward inflated accounts; pressures legitimate creators to participate.
- Platforms: Compromised discoverability harms ecosystem health and viewer experience (“Dead Internet Theory” dynamics).
4.3 Practical Detection Signals
- Track chatter-to-CCV (flags near ≥1:15–1:20), CTR vs. CCV, and raid-aligned vs. unaligned bursts.

- Check geo mix vs. declared audience; watch for cointegration between CCV and follower/subscriber series.
- Evaluate post-discovery tapering as a signature of strategic manipulation.
5. Limitations
- Sampling frame: Sponsored streamers overrepresented; general-platform prevalence likely 20–30%, but heavy botting among top-view streams inflates global averages.
- Measurement error: Bot classification relies on proxy signals; some false positives/negatives are possible.
- Conflict of interest: Vodra’s commercial role may introduce bias; results presented with CIs, p-values, and documented methods to enhance credibility.
- Attribution: Agency/farm involvement inferred from clustering and costs; direct contractual evidence not included.
6. Conclusion
Across Jan–Aug 2025, evidence within a 95% confidence framework shows that livestream viewbotting on Twitch and Kick is prevalent, strategic, and frequently centralized through agencies and farms — especially during discovery. Without independent verification layers, advertisers face material ROI degradation, and creators/platforms experience systemic incentive distortions.
7. Data & Methods (Condensed Technical Appendix)
- Statistical methods: Stratified random sampling; confidence intervals/levels; CTR variance analysis; geographic traffic distribution; 10k bootstrap; KS tests; 30-sec granularity time-series modeling; Pearson r; Engle–Granger cointegration; chatter-to-CCV ratio analysis.
Key parameters:
- N(streamers) = 4,567, N(streams) = 52,314
- Twitch prevalence: 39.6% (95% CI: 34.9–44.3)
- Kick prevalence: 68.7% (95% CI: 63.5–73.9)
- Discovery taper: 22–30 pp within 72 h
- CTR delta (suspect vs. baseline): up to –61%
- Chatter: CCV (suspect vs. organic): 1:18 vs. 1:6
- Growth coupling: r = 0.29 (botted) vs. r = 0.78 (organic)
8. Practitioner Notes (“Key Charts & Insights” reframed)
- Signal thresholds: Chatter-to-CCV, follower-to-CCV, and sub-to-CCV provide discriminative ranges for botting degree.
- Inverse relation: Higher bot% → lower active-chatter ratio (even with some botted chatters present).
- Scale invariance: Viewbot ratios track CCV across small to very large channels.
- Tier artifacts: Clusters near 200–300 and 1,200–1,400 CCV align with market “packages.”

- Cost structure: “Enterprise” tiers suggest agency financing rather than third-party trolling.

9. Acknowledgments and How to Cite
Acknowledgments: Thanks to the Vodra Ads engineering and data teams for telemetry access and to community analytics providers (StreamsCharts, SullyGnome, TwitchTracker).
Suggested citation: Vodra Research Team (2025). Livestream Viewbots on Twitch and Kick: A Quantitative and Behavioral Analysis (Jan–Aug 2025). Working paper.
10. Transparency Statement
This manuscript reformats Vodra’s internal report for academic presentation without altering reported figures or claims. Vodra is “in possession of large amounts of stream data as well as advertiser performance stats,” which informed the analyses. Updates may follow as more data are incorporated.
11. Glossary of Terms
- API: Application Programming Interface — A set of rules and tools for building software and applications. In this context, it refers to the method used to retrieve data from Twitch (e.g., Twitch API/Helix).
- CCV: Concurrent Viewer Counts — The number of people watching a livestream at any given moment.
- CI: Confidence Interval — A range of values, derived from statistical data, that is likely to contain the true value of an unknown population parameter.
- CTR: Click-Through Rate — The ratio of users who click on a specific link (like an ad) to the total number of users who view it.
- DB: Database — An organized collection of structured information, or data, typically stored electronically in a computer system.
- GEO: Geographic / Geolocation — Pertaining to the physical, real-world location of an internet-connected device.
- IP: Internet Protocol — The set of rules governing the format of data sent over the Internet or other networks. An IP address is a unique identifier for a device.
- IRC: Internet Relay Chat — A text-based chat protocol. Twitch’s chat system is built on a modified version of IRC.
- KS: Kolmogorov–Smirnov — A statistical test used to determine if two one-dimensional probability distributions differ.
- N: Number — A statistical symbol representing the total number of items or participants in a sample (e.g., N(streamers)).
- pp: Percentage Points — The unit for the arithmetic difference of two percentages.
- ROAS: Return on Ad Spend — A marketing metric that measures the amount of revenue earned for every dollar spent on advertising.
- ROI: Return on Investment — A performance measure used to evaluate the efficiency or profitability of an investment.
- SD: Standard Deviation — A measure of the amount of variation or dispersion of a set of values.
- SEA: Southeast Asia — A geographic region mentioned as a source of anomalous traffic.